
In the world of investing and trading, understanding technical analysis vs fundamental analysis is crucial for making informed decisions. Whether you’re a beginner investor or an experienced trader, grasping the differences between these two approaches can significantly impact your investment strategies. Technical analysis focuses on price movements and market trends, while fundamental analysis delves into a company’s financial health and economic factors. This article explores both methods in depth, highlighting their strengths, weaknesses, and how to combine them for optimal results. By comparing technical analysis vs fundamental analysis, you’ll gain insights into stock market analysis, chart patterns, financial ratios, market trends, and economic indicators—key elements that drive successful trading and investing.
What Is Fundamental Analysis?
Fundamental analysis is a method used to evaluate the intrinsic value of a security by examining related economic, financial, and qualitative factors. This approach assumes that the market price of an asset may not always reflect its true worth, and over time, the price will adjust to match this intrinsic value.
Key Components of Fundamental Analysis
- Financial Statements: Analysts review balance sheets, income statements, and cash flow statements to assess a company’s assets, liabilities, revenues, expenses, and profitability.
- Financial Ratios: Essential metrics include price-to-earnings (P/E) ratio, return on equity (ROE), debt-to-equity ratio, and earnings per share (EPS). These ratios help gauge financial health and efficiency.
- Economic Indicators: Broader factors like GDP growth, inflation rates, interest rates, and unemployment data influence market conditions.
- Qualitative Factors: This includes management quality, brand strength, competitive advantages (moats), industry trends, and regulatory environment.
For example, in stock market analysis, fundamental analysts might study a tech company’s R&D spending and patent portfolio to predict long-term growth. Unlike technical analysis, which ignores these details, fundamental analysis provides a foundation for value investing strategies.
Tools for Fundamental Analysis
Popular tools include Bloomberg terminals, Yahoo Finance, and financial modeling software like Excel for discounted cash flow (DCF) models. These help in forecasting future earnings and valuing stocks based on economic outlook.

Business Success: Insights from “Keys to the Vault”
What Is Technical Analysis?
Technical analysis is the study of past market data, primarily price and volume, to forecast future price movements. It operates on the premise that history tends to repeat itself due to market psychology, and all relevant information is already reflected in the price.
Key Components of Technical Analysis
- Chart Patterns: Common formations include head and shoulders, double tops/bottoms, triangles, and flags, which signal potential reversals or continuations.
- Technical Indicators: Tools like moving averages (simple and exponential), Relative Strength Index (RSI), Moving Average Convergence Divergence (MACD), and Bollinger Bands help identify trends, momentum, overbought/oversold conditions, and volatility.
- Trend Analysis: Identifying uptrends, downtrends, and sideways markets using support and resistance levels.
- Volume Analysis: Trading volume confirms the strength of price movements; high volume on breakouts indicates conviction.
In investment strategies, technical analysts might use candlestick charts to spot bullish engulfing patterns for entry points. This contrasts with fundamental analysis, which overlooks short-term price action in favor of long-term value.
Tools for Technical Analysis
Platforms like TradingView, MetaTrader, and Thinkorswim offer charting software with backtesting capabilities. These tools enable traders to apply oscillators and overlays for precise market timing.

What Is a Cup-And-Handle Pattern? | Indication & Limitations
Key Differences Between Technical Analysis and Fundamental Analysis
Understanding the differences between technical and fundamental analysis is essential for choosing the right approach. Here’s a detailed comparison:
| Aspect | Technical Analysis | Fundamental Analysis |
| Focus | Price action, charts, and patterns | Intrinsic value, financials, and economy |
| Time Horizon | Short-term (days to weeks) | Long-term (months to years) |
| Data Used | Historical price and volume data | Financial statements, economic reports |
| Assumptions | Markets are inefficient in the short term; history repeats | Markets eventually reflect true value |
| Tools | Indicators like RSI, MACD; chart patterns | Ratios like P/E, ROE; DCF models |
| Users | Day traders, swing traders | Value investors, long-term holders |
| Strength | Timing entries/exits | Identifying undervalued assets |
This table highlights how technical analysis vs fundamental analysis serves different purposes in stock market analysis and beyond. While technical focuses on market trends and chart patterns, fundamental emphasizes financial ratios and economic indicators.
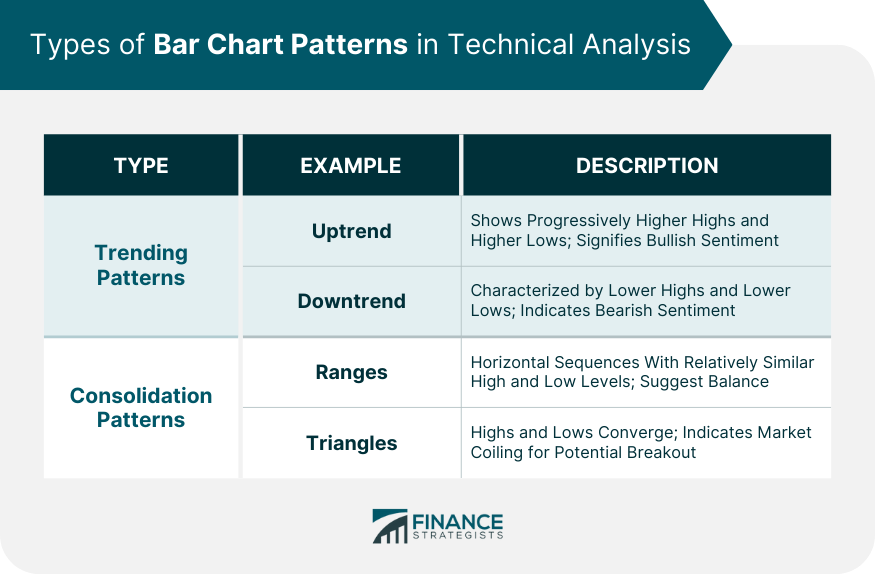
Bar Chart | Definition, Patterns, Applications, Pros and Cons
Pros and Cons of Fundamental Analysis
Pros
- Provides deep insights into a company’s true worth, aiding in value investing.
- Helps mitigate risks by identifying strong fundamentals amid market volatility.
- Incorporates qualitative factors like management expertise and industry disruptions.
- Effective for long-term investment strategies, often leading to compounding returns.
Cons
- Time-consuming, requiring extensive research on financial statements and economic indicators.
- May overlook short-term market trends driven by sentiment.
- Subjective interpretations of qualitative data can lead to biases.
- Less useful in highly volatile markets like crypto, where fundamentals evolve rapidly.
Pros and Cons of Technical Analysis
Pros
- Enables quick decision-making based on real-time price action.
- Versatile across assets, from stocks to forex and commodities.
- Incorporates market psychology through patterns and indicators.
- Supports risk management with stop-loss levels and trend lines.
Cons
- Ignores underlying financial health, potentially leading to losses in fundamental shifts.
- Prone to false signals in choppy markets.
- Relies on historical data, which may not predict black swan events.
- Can become a self-fulfilling prophecy if too many traders follow the same patterns.
When to Use Fundamental Analysis
Opt for fundamental analysis in scenarios like:
- Long-term investing in blue-chip stocks, where financial ratios predict growth.
- Evaluating mergers or acquisitions based on synergies and economic indicators.
- During earnings seasons to assess quarterly reports.
- In stable markets, such as bonds or real estate, focusing on intrinsic value.
This approach shines in value investing, as pioneered by Benjamin Graham.
When to Use Technical Analysis
Choose technical analysis for:
- Short-term trading, like day trading forex pairs using chart patterns.
- Identifying entry/exit points in trending markets.
- High-volatility assets like cryptocurrencies, where price action dominates.
- Complementing news events with immediate trend analysis.
It’s ideal for swing traders monitoring support and resistance levels.
Combining Technical and Fundamental Analysis: The Hybrid Approach
Many experts advocate blending technical analysis vs fundamental analysis for superior results. Use fundamentals to select assets with strong intrinsic value, then apply technicals for optimal timing. For instance, identify an undervalued stock via financial ratios, and enter when RSI shows oversold conditions.
Steps to combine:
- Screen stocks with solid fundamentals (e.g., low P/E, high ROE).
- Analyze charts for bullish chart patterns.
- Monitor economic indicators alongside technical indicators.
- Backtest strategies to refine the hybrid model.
This method addresses gaps in each, enhancing investment strategies.
Applications in Different Markets
Stocks
In equities, fundamental analysis dominates for long-term holds, analyzing earnings and dividends. Technical analysis aids in timing IPOs or earnings rallies.
Forex
Technical analysis is prevalent due to 24/7 trading and liquidity, using trend lines and Fibonacci retracements. Fundamentals like interest rate decisions provide context.
Cryptocurrency
Crypto relies heavily on technical analysis for volatile price swings, but emerging fundamentals (e.g., blockchain adoption) are gaining traction.
Commodities
As in futures (e.g., oil), combine supply/demand fundamentals with chart patterns for shocks like geopolitical events.
Historical Evolution and Key Figures
Fundamental analysis traces to Benjamin Graham’s “Security Analysis” (1934), emphasizing margin of safety. Technical analysis stems from Charles Dow’s theories in the late 1800s, founding Dow Jones.
Modern evolutions include quantitative funds using AI for both.
Advanced Topics: Quantitative Analysis and AI
Integrate quantitative methods like algorithmic trading, where machine learning analyzes big data for patterns. AI enhances technical indicators and automates financial ratio screening, bridging the gap in technical analysis vs fundamental analysis.
Case Studies and Real-World Examples
- Warren Buffett (Fundamental): Built wealth through value picks like Coca-Cola, ignoring short-term charts.
- Paul Tudor Jones (Technical): Predicted 1987 crash using chart patterns.
- Hybrid Success: Tesla’s rise—fundamentals (EV growth) met technical breakouts.
Common Mistakes to Avoid
- Over-relying on one method, ignoring market psychology or economic indicators.
- Keyword stuffing in analysis (focus on density naturally).
- Neglecting risk management in volatile market trends.
- Failing to update strategies with new data.
Tools and Software for Each
- Fundamental: FactSet, Morningstar for reports.
- Technical: StockCharts, NinjaTrader for indicators.
- Hybrid: QuantConnect for backtesting.
Future Trends in Technical and Fundamental Analysis
With AI and big data, expect more integration. Blockchain for transparent fundamentals, and sentiment analysis from social media enhancing technical analysis. Climate factors will influence economic indicators in sustainability-focused investing.
Conclusion
In the debate of technical analysis vs fundamental analysis, neither is superior—it’s about context. Fundamental analysis excels in uncovering value through financial ratios and economic indicators, while technical analysis masters timing via chart patterns and market trends. By combining them, you create robust investment strategies that outpace the competition. Whether in stocks, forex, or crypto, mastering both ensures informed decisions in dynamic markets.
FAQs
What is the main difference between technical analysis and fundamental analysis?
Technical analysis focuses on price and volume for short-term predictions, while fundamental analysis evaluates intrinsic value for long-term insights.
Can I use both technical and fundamental analysis together?
Yes, a hybrid approach uses fundamentals for selection and technicals for timing, improving overall stock market analysis.
Which is better for beginners: technical or fundamental analysis?
Beginners may start with fundamental analysis for understanding basics, then add technical analysis for practical trading.
How do economic indicators affect fundamental analysis?
They provide context on market conditions, influencing company performance and investment strategies.
What are some common technical indicators?
RSI, MACD, and moving averages help identify market trends and overbought conditions.